List Widgets
There are several list widgets (widgets from now on) available on the InterMine list analysis page, and they are configured in Data and Widget Configuration.
There are three categories of widgets:
table
Displays the counts from the list for the collection specified
graph/chart
Displays a graph/chart based on a dataset you specify
enrichment
Displays the p-values of objects that appear in your list
To add a widget to your mine:
- Add config to your
webconfig-model.xmlfile - Re-release your webapp
- View widget in a list analysis page
Below are the details on how to configure each widget type.
Note Please read the documentation carefully and check your config file for typos. Most attributes are case sensitive. When the webapp is released, the config is validated and any errors are displayed in the home page.
Configuration#
Table widgets#
Table widgets display objects and the counts of related objects in your list.
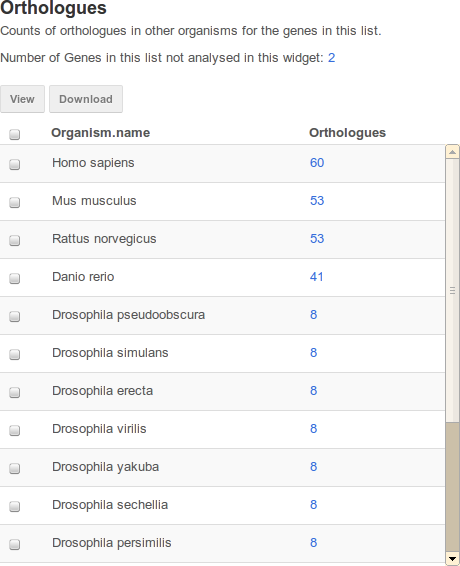
An example table widget of Orthologues in FlyMine.
| attribute | purpose | example |
|---|---|---|
id | unique id used by JavaScript only. Spaces not allowed. | unique_id |
pathStrings | which collection to use in the widget | Gene.homologues[type=orthologue].homologue.organism |
exportField | which field from the objects in your list to export | primaryIdentifier |
typeClass | types of lists that should display this widget. Use the simple class name | Gene |
The following are optional attributes:
| attribute | purpose | example |
|---|---|---|
title | appears at the top of the widget | Orthologues |
description | description of the widget | Counts of orthologues |
displayFields | which fields from the objects in the collection (in the above example, Gene.proteins) to display, eg. primaryAccession | name |
columnTitle | heading for the “count” column | Orthologues |
externalLink | link displayed next to first column, identifier will be appended to the link | |
externalLinkLabel | label for external link | |
views | path fields display in the query running when the user clicks on the widget | symbol |
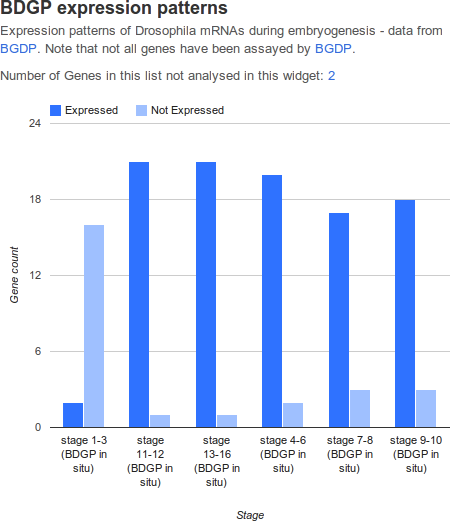
Graph/Chart widgets#
Graph widgets display datasets in graphical format.
| attribute | purpose | example |
|---|---|---|
| id | unique id used by JavaScript only. Spaces not allowed. | unique_id |
| graphType | which type of chart to render | ColumnChart,``BarChart`` or PieChart |
| startClass | it’s the root class for all the paths specified in the configuration [1]. | Gene |
| typeClass | type of lists that should display this widget. Use the simple class name. | Gene |
| categoryPath | Must be attribute. We can specify the subclass using the syntax path[subclass type] | mRNAExpressionResults.stageRange |
| seriesPath | the series path. This has to be an attribute. We can specify the subclass using the syntax path[subclass type] | mRNAExpressionResults.expressed |
| seriesValues | the values of different series. Case sensitive. You can specify Boolean values | true,false or Up,Down |
| seriesLabels | the labels displayed on the graphs to distinguish the different series inside a category | Expressed,Not Expressed or Up,Down |
| views | attributes paths displayed when the user clicks an area on the graph | name,organism.name |
[1] All the paths set, will be built starting from that. Specify only the simple name (e.g.
Gene). You can choose to set the bag type class or the root class associated to the category path.
Warning
You can specify only one class in typeClass. If you need another type, you have to define a new widget.
The following are optional attributes:
| attribute | purpose | example |
|---|---|---|
title | appears at the top of the widget | BDGP expression patterns |
description | description of the widget | Expression patterns |
domainLabel | Label displayed on x-axis in the ColumnChart (on y-axis in the BarChart) | Stage |
rangeLabel | Label displayed on y-axis in the ColumnChart (on x-axis in the a BarChart) | Gene count |
filterLabel | label for filter form field | Organism |
filters | the values for the filter, set in the dropdown [2]. | All,KEGG pathways,Reactome data |
listPath | the path used to build the bag constraint [3]. | FlyAtlasResult.material |
constraints | separated by comma, case sensitive, must be attributes, operator can be = or != [4] | organism.name=[Organism] [5] |
[2] We can use static values or a grammar to specify the values contained in the list. The default value in general is the first value set in the ‘filters’ attribute or the first value returned by the query. With static values, you can add ‘All’ meaning no filter applied.
[3] Optional if the startClass contains the bag type class.
[4] For the values, we can use static values or the selected filter value using the syntax: path constraint = [filter identifier].
[5] organism’s name matching with the value selected in the filter with filterLabel ‘Organism’
Note The graphs use Google Visualitation API.
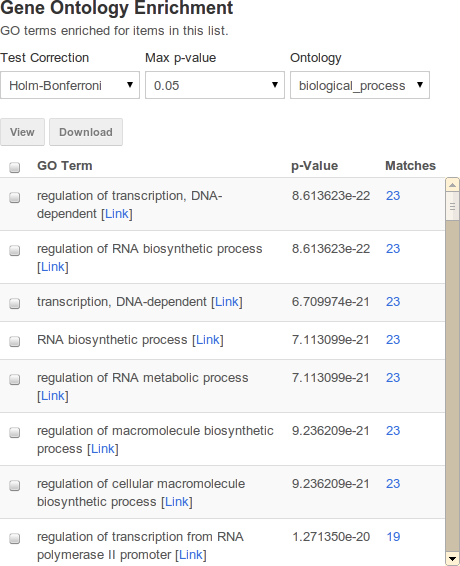
Enrichment widgets#
Enrichment widgets calculate p-values representing the probability annotation occurred by chance. See List enrichment widgets statistics for more information on how the p-value is calculated.
| attribute | purpose | example |
|---|---|---|
id | unique id used by JavaScript only. Spaces not allowed. | unique_id |
startClass | Root class for all the paths specified in the configuration. Use simple name (e.g. Gene) | Gene |
startClassDisplay | Field displayed when user clicks on the widget on ‘Matches’ column | primaryIdentifier |
typeClass | Type of lists that should display this widget. Use the simple class name. | Gene |
enrich | Field to be enriched, displayed in the widget in the first column [6]. | goAnnotation.ontologyTerm.parents.name |
views | attributes paths displayed when the user clicks on View results button [6]. | symbol,organism.name |
[6] (1, 2) You have to specify only one field. Specify the subclass using the syntax path[subclass type].
Warning
You can specify only one class in typeClass. If you need another type, you have to define a new widget.
The following are optional attributes:
| attribute | purpose | example |
|---|---|---|
title | appears at the top of the widget | Gene Ontology Enrichment |
description | description of the widget | GO terms enriched. |
label | heading for the column | GO Term |
externalLink | link displayed next to first column | googie |
filters | extra filters to add to the display [7] | organism.name=[list] |
filterLabel | label for filter form field | Ontology |
enrichIdentifier | identifier for the row displayed, if not specified, enrich field used [8]. | goAnnotation.ontologyTerm.identifier |
constraints | constraints separated by comma. The paths have to be attributes. The operator can be = or != [9]. | organism.name=[list] |
constraintsForView | constraints separated by comma used for building the query executed when the user clicks on the widget on ‘Matches’ column | results.expressed = true |
correctionCoefficient | set to org.intermine.bio.web.widget.GeneLenghtCorrectionCoefficient to normalize by gene length |
[7] Use static values or a grammar to specify the values contained in the list. The default value in general is the first value set in the ‘filters’ attribute or the first value returned by the query. With static values, you can add ‘All’ meaning no filter applied.
[8] Specify only one. This has to be an attribute. Used in the results table. Specify the subclass using the syntax path[subclass type].
[9] Case sensitive. For the values we can use: static values or the selected filter value using the syntax: path contraint = [filter identifier]. Only the value contained in the list.
Examples#
See other mines' config files for more examples, eg:
Background population#
In the enrichment widgets, you can change the reference population. The reference population is specific for widget, list and user. If you are logged on, you can save your preference selecting the checkbox 'Save your preference'. The background population selected should include all items contained in the list.
Gene length correction coefficient#
Depending on the type of experiment your data comes from, it is sometimes necessary to normalize by gene length in order to get the correct p-values. If your data comes from a genome-wide binding experiment such as ChIP-seq or DamID, binding intervals are more likely to be associated with longer genes than shorter ones, and you should therefore normalize by gene length. This is not the case for experiments such as gene expression studies, where gene length does not play a role in the likelihood that a particular set of genes will be overrepresented in the list. If you want normalize by gene length, add the attribute correctionCoefficient, set to 'org.intermine.bio.web.widget.GeneLenghtCorrectionCoefficient'. The gene length correction coefficient is applicable only for lists containing genes with a length, so for a list of genes that do not have a length, the option is not shown. If a list contains some genes without a length those genes will be discarded.
Export Values#
The exported file from enrichment widgets includes the enrichment identifier as the fourth column. It is contextual to the startClass attribute in the configuration. For example, an enrichment widget for publications would return the PubMedID field, whereas, a GO enrichment widget would return the GO Term field.
Displaying widgets#
JavaScript#
Widget service
Create a new Widgets instance pointing to a service:
Choose a widget
Choose which widget(s) you want to load:
CSS#
Note Widgets are using Twitter Bootstrap CSS framework.
Embedding mine widgets on a custom page#
The following describes how to embed widgets not in a mine context.
Open up a document in your text editor.
Use the InterMine JavaScript API Loader that always gives you the latest version of the widgets. In the
<head>element of the page, add the following line:Load the Widget Service:
intermine.loadrepresents a block of code that loads the widgets by pointing them to a specific mine.Use the widget web service to view which widgets are available on the mine, eg:
http://beta.flymine.org/beta/service/widgets/See which lists are available in the mine:
http://beta.flymine.org/beta/service/lists``Add a widget (from the list in the previous step) to JavaScript. So within the
intermine.loadblock, after creating theWidgetsinstance, do this:Where the first parameter passed is either type of object or name of widget to load. The second is the name of list (public list) to access and third is an element on the page where your widgets will appear. This element needs to obviously exist on the page first. A common one is a div that would look like this:
<div id="all-widgets"></div>.Add HTML, eg:
You will have noticed that the widgets either pickup a style (CSS) from your HTML page, or they appear unstyled. To style them, you can use a variant of Twitter Bootstrap.